Become a " Data Visualization" Specialist. In this learning path, you will learn " Data Visualization, Excel and Tableau, Power BI".
 1000+ Students enrolled
Become a " Data Visualization" Specialist. In this learning path, you will learn " Data Visualization, Excel and Tableau, Power BI".
Become a Data Science Specialist.
Data visualization is one of the key
skills when it comes to working with all kinds of datasets. As the quote says
“A picture is worth a thousand words”, so is the importance of data
visualization in a data-driven society. Data visualization works as a tool for any
data professional to better understand the data, helps in storytelling, helps
in quick and effective decisions and so much more. But how to get started? Don’t worry as we, at SkillLauncher, brings to you an amazing career path
course on “Data Visualization” which will take you on an amazing journey and
help you to learn various data visualization techniques and tools with
best-in-class content covering all topics starting from Python, Data
Visualization, Excel and Tableau, and Power BI. So, what are you waiting for?
Come, join us!


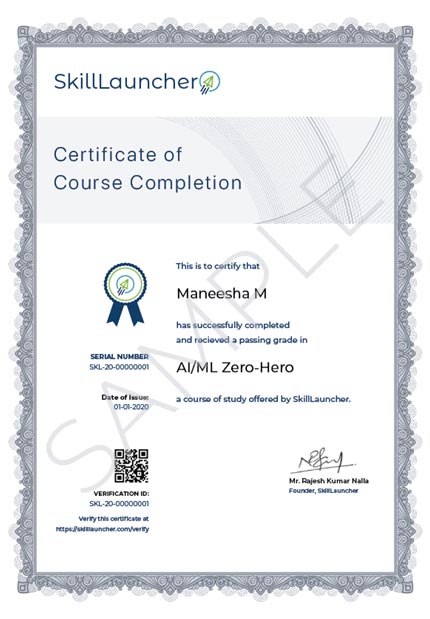
 Certificate
Upon successful completion of the Course, You will receive a Verifiable certificate with QR code. Now employers can verify the certificates just by scanning QR code or by verification ID.
The knowledge and skills you've gained working on projects, simulations, case studies will set you ahead of competition.
Talk about it on Linkedin, Twitter, Facebook, boost your resume or frame it - tell your friends about it.
Ajeet Deshpande
Student
Great learning platform for all type of learners, New trending courses with new teaching methods, really good work. Thanks SkillLauncher!
Pravin Pratap Basu
Student
Support on the courses is very good. Apart from that course materials are also good . Teaching faculties are also extremly supportive.
Basanti Mahal
Student
The courses are very good and well structured. SkillLauncher even covered more advanced topics which was not in agenda or course content.
Anil Prasad
Student
These guys rock with amount of patience, knowledge and love how to explain things and cannot thank enough for the extreme support and mentoring.
Rama Krishna
Student
Content of courses is amazing. No other online platform has as many courses with dedicated teaching assistance. It has some free tutorials with time access.
Pirzada Gagrani
Student
I was searching for a platform to learn AI/ML course and I came across this SkillLauncher. Their support was awesome from the day of enrollment.